How to build the perfect sandcastle

How to build the perfect sandcastle – according to science

File 20170619 12450 ng8uwn.jpg?ixlib=rb 1.1
Now you can do it too.
Matthew Bennett, Author provided

Matthew Robert Bennett, Bournemouth University

Whether we prefer water sports or relaxing with a good book, the humble sandcastle is often a seaside must. But what’s the secret to building a majestic sandcastle that will withstand the tide of time? Luckily, there’s a scientific formula for that.

It all started back in 2004, when a holiday company asked us to investigate the question. As a sedimentologist, someone who studies fragments of rock, I began pondering what kind of beach would work best for castle building. To find out, I compared the sand from the ten most popular beaches in the UK at the time. Though in truth any sandy beach will do, Torquay came out top with its delightful red sand, closely followed by Bridlington, with Bournemouth, Great Yarmouth and Tenby tied in third. At the bottom of the league was Rhyl.

Having selected a beach one has to find the perfect spot. Now this is a question of taste rather than hard rules. Some might prefer a spot close to the car park with easy access when the rain arrives while others might want to stay next to a cafe. Others yet might hanker after the secluded fringes of the beach, perhaps sheltered by natural promontories of rock that keep the biting wind at bay.

Torquay harbour.
averoxus/wikipedia, CC BY-SA

Now a castle should be a symbol of military strength, but to stand proud one needs strong sand. The strength of sand depends on the properties of its individual grains and on the water between them. The more angular the grains, the better they will lock together. The more a grain is transported the more rounded it becomes. Microscopic shell fragments work well in this regard. The finer the grains the more they hold the water. And water matters.

Too much water and your sand will flow, too little and it will crumble. You need to get it just right and your castle will stand proud and last. It’s all down to the surface tension of water – the thing that gives the “meniscus”, or skin, to a glass of water and holds down that glass when placed on a wet bar top. The film of water between individual sand grains is what gives sand its strength, too much and it lubricates one grain over the other, but just right and it binds them strong.

The magic formula

Now the experimentation we did suggested that the perfect sandcastle requires one bucket of water to eight buckets of dry sand. Or if you want the magic formula: Water = 0.125 x Sand. So assuming that you don’t have any science gear with you, then you are looking for a spot close to the high tide line – usually marked by a line of seaweed and flotsam – and the low tide line where sand is still visibly wet and the waves are close. But remember that this will change as the tide comes and goes during the day.

High tide line.

My next tip refers to quality of your tools. In my experience there is a direct correlation between the age of the builder, spade size and the speed at which boredom sets in. Adult helpers find the smallest spade nothing but frustrating, and while young assistants might aspire to use the biggest spade, it is often too big to handle. A selection of tools will keep the workforce in harmony. The bucket also has to be the perfect size and shape. The best buckets are the simple round ones – not the ones with the fancy turrets which when turned out produce a castle in itself. A round bucket will allow you turn out countless towers and architectural features. A single bucket can be turned out several times to create a large mound from which you carve an amazing tower.

As you build, spare a thought to the story, not just of the castle one is building with its tales of derring-do, but also the story of the sand itself. Each grain is a fragment of rock and contains a story of relict mountains, ancient rivers, dinosaur-infested swamps and seas, of past climates and events which tell the amazing story of our planet. The red sand of Torquay once blew in giant sandstorms, as the area was once part of a desert far greater than that of the Sahara. The sand at Bridlington or Great Yarmouth tells a tale of giant ice sheets and drowned lands below the North Sea.

My next tip refers to size. Yes, size matters – at least in the game of sandcastles. The modest castle with perfect towers, battlements and moat is ok, but it is the huge castles which break the beach horizon that inspire awe and wonderment in people that pass by. Think big! Pebbles, shells, driftwood fragments and feathers all enhance a castle. And let’s face it: a castle is about being seen. And although there may be science behind the humble sandcastle, don’t forget to have fun building it.The Conversation

Matthew Robert Bennett, Professor of Environmental and Geographical Sciences, Bournemouth University

This article is republished from The Conversation under a Creative Commons license. Read the original article.

How to take measurements from a photograph

Digital photographs have become a key part of the scientist’s observational toolkit.  In a forensic context photographs provide a vital source of evidence.  Taking accurate digital measurements is an important skill.

“I have never used Photoshop, how can I get a good grade?”

“Can’t I just measure from the photo?””

“It’s beyond my comfort zone!”

“What happens if I did not include a scale bar?”

The study skills unit is about learning new skills about stretching your horizons and above all else investing time in your own professional development.  This is one of those skills or pieces of ‘know-how’ that is worth investing.

So invest the time to learn something new; it won’t be easy but it will make you a better professional given practice.  As with any task there are many different ways of approaching a task and one is not necessarily better than another.

Simple measurements

Open Photoshop and navigate to the photograph that you want to take measurements from.  The photograph must not be oblique; that is the line from the camera lens to the object (and surface its rests on) must be orthogonal (at right angles).  Compare Figures 1 and 2 one is good for taking measurements and one is not.  We now need to make sure the Rulers are visible in the window; go to View >> Rulers to turn them on.  By right clicking on the ruler you can change the units of measurements (Fig. 3).  Initially we want pixels so select this.  Now we need the measurement tool which looks like a cartoon version of a ruler and is hidden with a range of other tools including the eye dropper on the left hand pallet.  Any of the buttons on the left hand pallet that has a small triangle in the bottom corner has more than one tool hidden there; click and hold on the upper most icon and a pull out menu will appear allowing you to find the tool you want (Fig. 1).  If you use it a lot you can custom the tool bars.

fig1
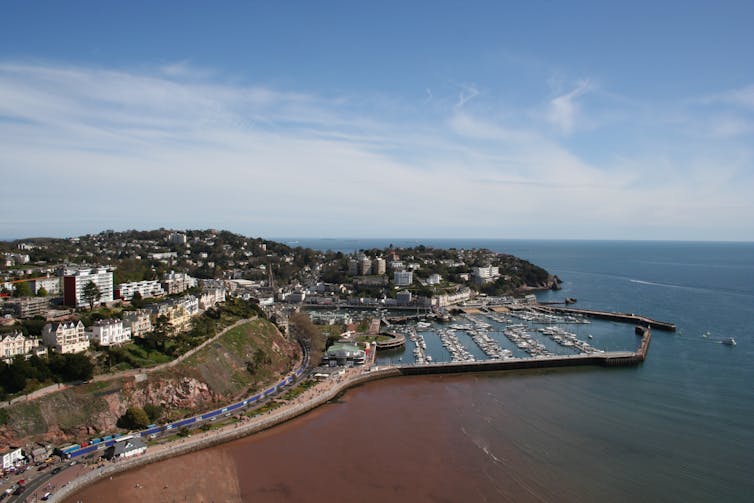
Figure 1: Image ready for measurement.  Note that it is orthogonal to the camera.  The scale bar is square in the picture.  Compare to Figure 2.

fig2Figure 2:  The same object in Figure 2 but from an oblique angle.  In this case any measurements made would not be true distances. 

Using the measurement tool measure accurately the distance on your scale bar between two point.  For example the distance between 0 and 15 cm which is the length of the scale bar (Fig. 4).  The number of pixels this corresponds to will appear in the top tool bar, circled in red in Figure 4.  Remember we set the units to pixels by right clicking on the rulers (Fig. 3).

fig3

Figure 3: Changing the units by right clicking on the ruler.

fig4

Figure 4: Measuring the length of the scale bar in pixels

In my case the distance is 2596 pixels, so if we divide this by 15 we get the number of pixels per centimetres which is 173.06.  Write this number down.  Now we can give this information to Photoshop so that it is correctly calibrated for this photograph.  Go to Image >> Image Size (Fig. 5).  Now adjust the drop down so that it shows pixels/centimetre and write in the figure of 173.06.  Uncheck the resample and constrain check boxes (Fig. 5) and press OK.

fig5

Figure 5: Calibrating the image for measurements.

The image is now correctly calibrated.  If we wanted to permanently set the image to 1:1 then we could leave the ‘Resample Image’ checked and it would re-sample and adjust the image permanently.  If you wanted to print the image at 1:1 then this is what you would do.  However in our case we don’t want to unnecessarily and perhaps detrimentally adjust the image resolution so leave it unchecked.  If you now go back to the rulers and right click you can change the units back to something useful like millimetres or centimetres. So next we much check the accuracy of our calibration.  There are two ways of doing this.  Firstly if you measure between 0 and 15 cm on the scale bar the figure of 15 cm should appear in the measurement value (Fig. 6).  Secondly, you can drag two guides to one corner of your scale bar and then drag the origin of the ruler to that point.  You do this by left clicking on the origin (point where the vertical and horizontal rulers meet).  The measurements on the rulers should now correspond to those of the scale bar.  You can now proceed to take as many measurements as you wish (Fig. 6).  If the calibration is not quite right then you need to repeat the steps above.  You have calibrated your first photograph for measurement; congratulations!

fig6
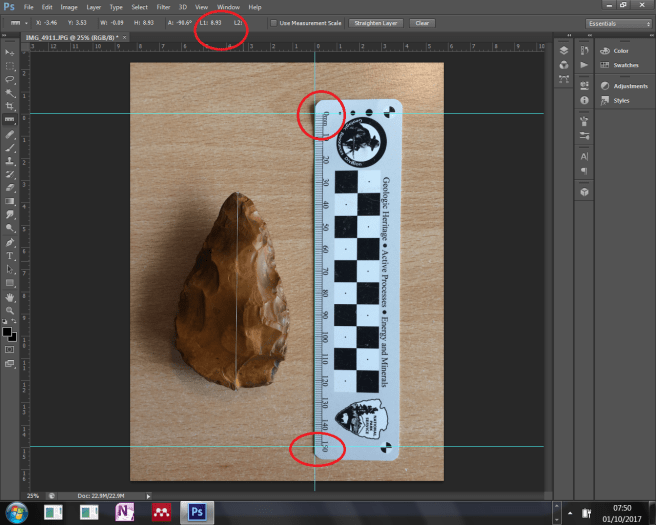
Figure 6: Calibration checks assuming the checks are good you are now ready to measure your artefact.

You can also measure angles.  Use the measuring tool in the normal way but then depress and hold down the Alt key when you have drawn the line this will allow you drag out a new line.  The angle between the two lines is recorded in the toolbar (Fig. 7).

fig7Figure 7 Measuring angles in Photoshop.  Drag a measurement line 1-2 then depress and hold the Alt key down to drag out a third line 3.  The angle between the two lines is shown in the main toolbar.

Multiple measurements

If you have multiple measurements to make on a single image there is a facility in Photoshop to create a measurement log and to export this as a Text-file.  This can be very useful.  Go to Windows >> Measurement Log a horizontal window will appear along the bottom of the screen.  You now need to set the measurement scale (Fig. 8).  Essentially you are being asked to add in the same information as before; how many pixels equals your unit of measurement (Fig. 9).  You can now continue to makes a series of measurements; after each one you need to press ‘record measurement’.  Once you have completed your measurements you can export the log by clicking on the ruler icon with an arrow embedded.  This is located in the top right hand side of the measurement log window (Fig. 10).  It is important to realise that the system only records the measurements so you need to keep a written note or sketch in your notebook of what each measurement corresponds to.  Files are exported as Text-files.

fig8Figure 8: Measurement log.  Click the stack of lines on the right hand edge of the upper part of the window to bring up the ‘Set Measurement Scale’.  Select Custom to bring up the dialogue box in Figure 9.

fig9
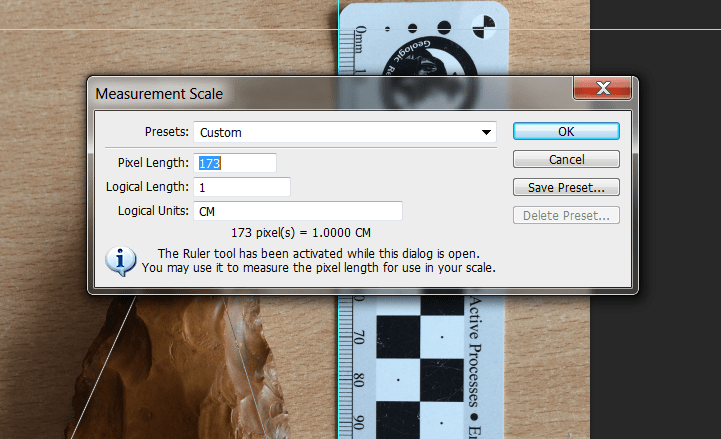
Figure 9: Setting the measurement scale.  You need to type in the number of pixels that corresponds to a cm.

fig10
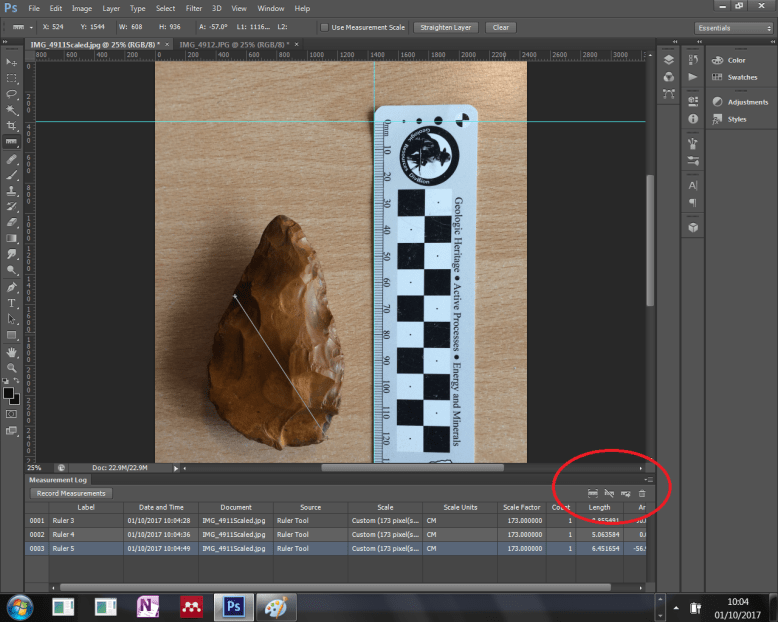
Figure 10: Measurement log in action.  You will find the export function circled.

Correcting oblique images

If you did not take your images orthogonal to the plane then it is not ideal.  Sometimes this can be difficult to achieve such as in the case of buildings, where they will always appear foreshortened unless you can get far enough away from them.  There are several ways of correcting for this within Photoshop and some excellent perspective tools.  The way I am going to show here is just one solution that I find useful provided that there is a square object in the frame.

My preferred solution is to use the Perspective Crop tool.  You will find this hiding below the crop button; it looks like a mesh (Fig.11).  Use this tool to draw out a grid approximately near the square object (Fig. 12).  Now take the corners and place them on the corners of the scale bar.  Having done this place the cursor on the side walls of the grid and pull them out to extend it in all dimensions over the key parts of the image (Fig. 13).  Now clip crop.  The plane is corrected and you can proceed to make measurements as before (Fig. 14).  It is not ideal and there are several opportunities for error so avoid using this if possible.

fig11
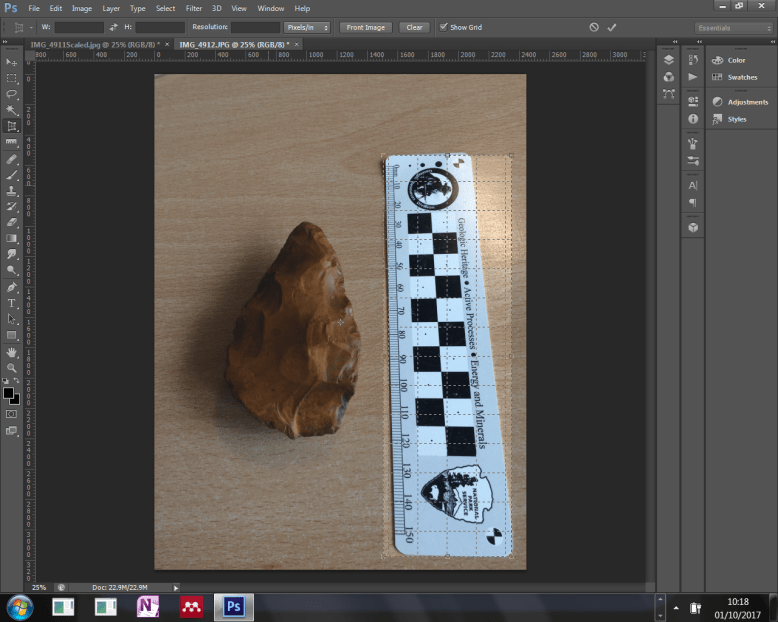
Figure 11: Deploying the perspective crop tool.

fig12
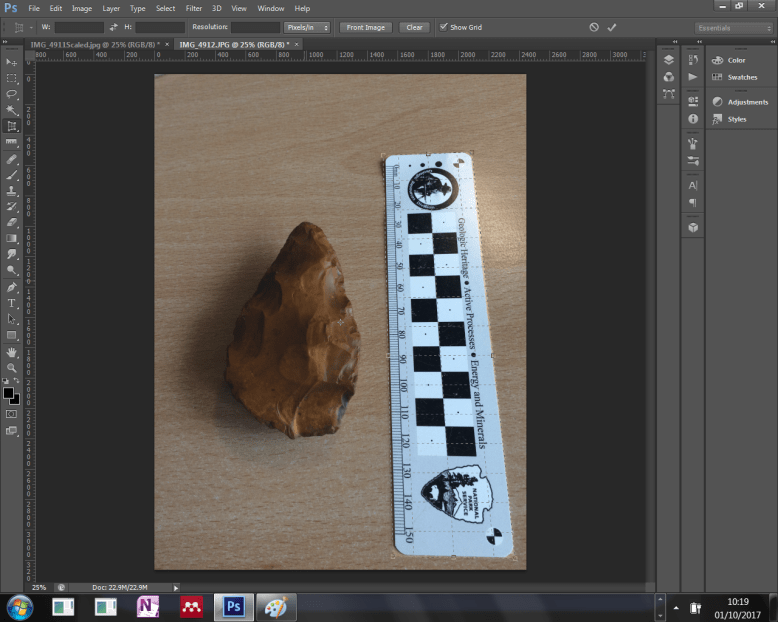
Figure 12: Drag the corners with the cursor so they are on the object of something you know to be square, in this case the scale bar.

fig13
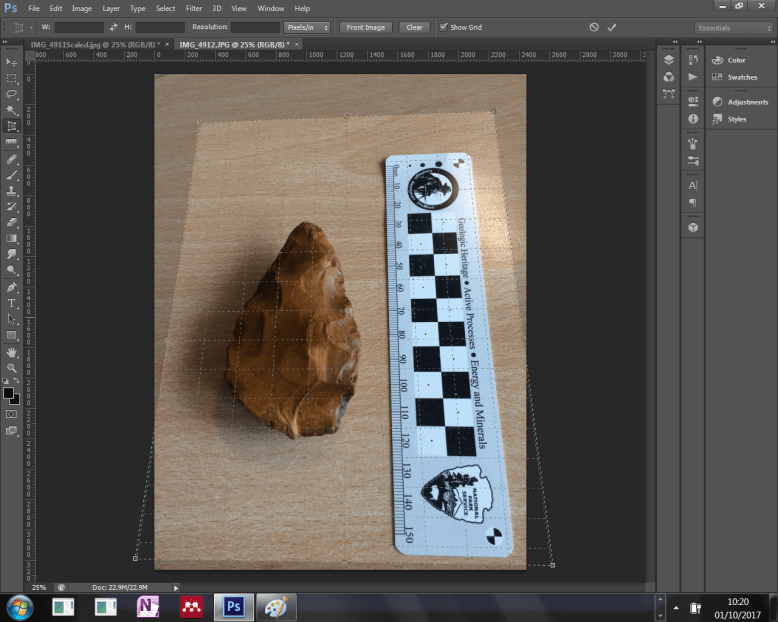
Figure 13: Extending the sides of the crop tool beyond the initial square.

fig14Figure 14: The final cropped and corrected image ready for measurements

What is the point of physical geography?

Imagine that you are a first year student sitting there fresh-faced in your first physical geography lecture.  Some of you will be excited having done physical geography at A-level and enjoyed it, others will be saying ‘I only like human geography, the physical stuff is boring!”  Perhaps others will be saying “I am an ecologist, why do I have to learn this geology stuff?”  All are valid viewpoints.  I have spent my life as a geographer, come geologist, working in the high arctic on glacial processes, reconstructing our Ice Age past, studying the geography of human evolution in Africa and applying geomorphological expertise to the study of forensic footprints at crime scenes. 

 It is hardly surprising therefore that I believe the world’s leaders and decision-makers all need to be both scientifically and geographically literate.  We must overcome huge challenges in the coming years as the Earth’s climate changes.  What ever happens about greenhouse gas emissions climate will change, in fact change is normal!  Geographers can help decision-makers face these challenges and inform the solutions.   Let me try and show you why geographers matter. 

Roll the clock forward and imagine that you are now working for an aid organisation coordinating humanitarian relief.  The news breaks of a major earthquake in northern Pakistan.  You have to mobilise people, resources and get them to the epicentre fast.  The questions flood in: what is the terrain like, what is the vegetation like, what is the climate and weather doing and where are the transport lines most vulnerable to after-shocks? These are just a small selection – Google Earth and the internet has its limits.  Later you may be asked to advise on rebuilding lost infrastructure or improving disaster/emergency planning.  All these questions are underpinned by physical geography.

If you don’t like this scenario image yourself as a conservation worker in Africa saving the white rhino.  The rhino is a product of its environment, the distribution of soil and food resources and its movements limited by the local terrain.  Climate change and local weather patterns all play apart in its survival even before we consider the social and cultural aspects that lead to is predation by poachers.

I could go on.  Understanding the Earth’s surface terrain its shape, composition and the processes that formed it in the past and that shape it now and will in the future is fundamental to almost all human interaction with the planet we live on.  That is what physical geography is about.  It is the foundation of environmental and ecological science a key component of geology and therefore to our understanding of Earth history and our past.  That is why all those interested in ecology, geology and the environment need to be versed in the fundamental Earth systems.

Definition and history

Physical geography is the study of the processes that shape the Earth’s surface, the animals and plants that inhabit it, and their spatial distribution.  This surface lies at the interface between the lithosphere and the atmosphere and is shaped by both.  Its study is by definition multi-disciplinary therefore drawing on geology and meteorology, and is fundamental to understanding the ecology and biogeography our planet.

As a discipline it emerged in the mid- to late 1800s with geomorphologists dominating the discipline at first (Table 1).  The emphasis was on the description of landscapes, climates and biomes. Ideas of environmental determinism dominated in which landscapes in particular were seen as part of development trajectories.  For example, William Morris Davis (1850-1934) saw fluvial landscape in a series of age related cycles.

Geographical sub-disciplines
Geomorphology – shape of the Earth’s surface and processes by which it is shaped, both at the present as well as in the past. It is closely linked to Geology.
Hydrology – the distribution, movement and quality of water on the land surface and in the soils and rocks near the surface.  Ground water hydrology is known as geo-hydrology.
Glaciology – study of the Earth’s current glaciers and ice sheets (cryosphere).  It is closely associated with Quaternary Science.
Biogeography – study of the geographic patterns of species distribution and the processes that result in these patterns.
Climatology – study of the Earth’s climate or weather patterns that predominate at a location, distinct from meteorology which is the study of day-to-day weather.
Pedology or Soil Science – the study of soils in their natural environment.
Oceanography – the study of the Earth’s oceans and seas, many people would recognise this as a discipline in its own right.
Quaternary Science – is the inter-disciplinary study of the Quaternary period, which encompasses the last 2.6 million years. This includes understanding past climates, landscape changes, ice sheets and the mechanisms of both climate and environmental change.
Geomatics – is the collection and process of geographically relevant ‘big-data’ from satellites and Earth observation systems.
Environmental Geography – this focuses on the interaction of humans and the natural world. In some respects it lies at the interface between human and physical geography.

Table 1: Some of the main sub-disciplines in Physical Geography.

Physical geography along with human geography underwent radical period of quantification in the late 1950s and early 1960s known as the Quantitative Revolution.  In geomorphology there was a radical shift from the description of landforms to process based experimentation on the mechanism by which landforms were formed.  What followed was massive growth in research and intense disciplinary specialisation around five broad themes: geomorphology, climatology, biogeography, soil science, and Quaternary environmental change

Today Physical Geographers remains an intrinsically inter-disciplinary subject of ever growing relevance as the pace of global environmental change accelerates. Geographers grapple with the inter-connected nature of the Earth’s fundamental geodynamic systems – lithosphere, hydrosphere, biosphere and atmosphere – and their impact on, and interaction with, different scales on the human use system.  It is by definition both local and global in scale and geographers’ bring their unique spatial and analytical skills to bear on these interactions.  Many geographers now recognise the Anthropocene as a new geological era; the era shaped by human activity.  It is an era in which geographical and scientific literacy are likely to be key to the survival of our species.

Succeeding in Physical Geography?

So you are still sitting there and now wondering how do I succeed in this unit?  How do I gain a fundamental knowledge of Physical Geography.  At this stage you probably want me to give you the answers to the exam or direct you to the magic ‘know it all geographical potions’.  Sadly the latter does not exist and the former would have William Davis turning in his grave.

The key is pro-active engagement in three vital areas, these are:

  • Preparation. Go on to Brightspace and engage with the material there.
  • Attend and engage. You will quickly find out that the lecture slides consist mainly of line diagrams and pictures.  Unless you note down the spoken words and explanations that go with them you won’t stand much chance of understanding the material.  If you could get everything from Brightspace why would we bother giving lectures?  You need to annotate a set of printed slides and write detailed notes during the lectures.  Without a good set of notes you will struggle and perhaps fail the unit – it’s that simple!  Take part in the discussions on the perspective pieces and use this as an opportunity to ask questions and seek greater understanding.
  • Reflect and read. So you leave the lecture and you are on to the next thing; your lecture notes end up at worse as a crumpled set of pages or at best get filed in a nice shiny, new binder.  You may even go as far as to buy a copy of one of the core texts and display it proudly on your shelves.  Have you ever heard of the ‘psychological value of unused information?’  People buy self-help books but never read them but feel better for having them – well that’s the concept.  It applies here – having that new shiny binder and copy of the core text makes you feel better, but in truth won’t improve your grade.  You need to engage with those notes and read the textbook!  You have to engage.  As soon as you get a chance after a lecture get the notes out and review them, don’t waste time copying them out and making them look pretty read and reflect them while making sure they are legible.  What do you understand and what don’t you?  What interests you and what left you feeling cold?  Look at the suggested reading list for the lecture provided each week and draw up a prioritised list of things to follow up on.  May be its to read a section of the core text and makes notes, may be it is to read suggested paper, or may be its to simply spend half an hour on the internet to get some specific examples, facts and illustrations.  Whatever it is augment your lecture notes by further research.  If you don’t understand stuff then be pro-active don’t sit there worrying about it – seek help.  You can get help from your Peer Assisted Learning (PAL) tutor if you have one or directly from the lecturer by attending one of the practical drop sessions.

Engage with the lectures as outline above and build a good body of notes and the assessment and exam will take care of themselves.

Goldilocks and the daisy?

Unfortunately scientist can slip into using cliches.  This is despite the fact that imagination and creativity are probably the key skills to successful science.  A quick Google Scholar search on the term ‘Goldilocks’ reveals over 24,000 scientific papers and books that use the term and only a small number of them involve three bears!  It has become shorthand for ‘just right’.  Understanding planetary temperatures is no exception.  Planet Earth is said to be located in the Goldilocks Zone of the solar system – not too far from the sun to be too cold, not to close to be too hot.  In practice, ‘just right’ conditions have prevailed throughout much of the 4.6 billion years of Earth history, the big question is why?

Just right: not too hot, not to cold

The probability of the Earth’s temperature remaining at suitable level for life to survive during much of the 4.6 billion years of Earth history has been described as a kin ‘to crossing a motorway blindfold during rush hour’.  When the Earth was first formed the solar constant, that is the amount of radiation received by the Earth from the sun, was lower than it is today.  The sun was dimmer and has been slowly warming ever since.  The solar constant has risen throughout Earth history but the average planetary temperature has remained broadly the same give or take a few wobbles.  The climate and the chemical properties of the Earth now and throughout its history seem always to have been optimal for life The question is why and how?

This observation led Professor James Lovelock to the radical conclusion that the Earth could regulate its own temperature just like any warm blooded animal.  He postulating thermo-regulation and coined the term Gaia – Goddess Earth – and suggested that the Earth was living.  In this context a living being is something able to regulate and optimise its environmental conditions.  He knew how to sell a story and the Gaia hypothesis was born.

Whether the Earth can truly be described as ‘living’ is largely irrelevant, the crux of the issue is that positive and negative feedback loops within planetary systems may operate against extremes just like the human body.  To hot and you begin to sweat, to cold and your body develops gooseflesh and a shiver.  The search was on to find self-regulating planetary systems and a number of such systems have emerged over the years.

One of the first of these was the role of dimethyl sulphide in cloud formation.  For condensation to occur you need condensation nuclei, tiny particles of dust or particulate matter around which water vapour can condense.  It is where ideas of cloud seeding in drought stricken areas come from.  Lovelock and his colleagues were able to demonstrate that a key condensation-nuclei was sulphur dioxide derived from dimethyl sulphide from plankton on the ocean surface.  As a result they found a large planetary feedback mechanism (Fig. 1).  The so called CLAW hypothesis was named after the authors involved in its discovery Charlson, Lovelock, Andrea and Warren (1987).

clawFigure 1: The CLAW hypothesis. (Source: Plumbago-Own work, CC BY 2.5, en.wikipedia.org/w/index.php?curid=12987086)

The sun acts to increase the growth rates of phytoplankton due either to increased surface temperature and/or increased availability of sunlight. Certain phytoplankton, such as coccolithophorids, synthesise dimethylsulphoniopropionate (DMSP), and their enhanced growth increases production.  As this breaks down dimethyl sulphide (DMS) is produced first in seawater, and then in the atmosphere. DMS is oxidised in the atmosphere to form sulphur dioxide an important condensation nuclei.  The water content of clouds increases as a result increasing their reflectivity to incoming solar radiation (enhanced albedo).  The result is less solar heating of the ocean surface and a decrease in phytoplankton production of DMS resulting in a self-regulatory system.

Scientific modelling

Geographical research is not all about direct observations and fieldwork; there is more to geography than standing in the rain measuring things.  Physical and laboratory based experiments all play a part as does modelling.  Modelling involves the conceptual or numerical simulation of a series of processes that give rise to something like a landform or ecological species distribution.  Modelling is a central to our understanding of many geographical phenomena; it lies at the heart of the weather forecast on your smart phone or TV.

There is a range of different opinions as to what actually constitutes a ‘model’ but the simplest way of looking at it as any construct which generates a prediction. It follows that modelling, like experimentation and observation, is simply an activity that enables theories to be tested and examined critically.  Here are a just a few different types of geographical model:

  • Conceptual models. These are theoretic expressions, often in cartoon form, of the key variables involved in a particular process.  They are designed to scope, inform, communicate and help the reader frame ideas for testing.  Figure 2 is a conceptual model.
  • Physical models. Flumes and wave machines are used sometimes to test coastal or flood defences.  Here reality is scaled down and observed in microcosm.
  • Empirical/statistical models. These are based on observed data and attempt to look for causal relationships between several variables.  Lots of data is collected and statistics are used to pull out salient points or relationships.
  • Numerical models. We can use physics and maths to create a set of equations which describe elements of a process.  For example, we can describe soil strength or the rate of glacier flow via simple equations.  These types of models can vary along a continuum from those that are specifically grounded in a time and place to those that are more abstract.  If we ground and parameterise these equations with data from a specific place or time we can attempt to model and thereby reconstruct (or predict) phenomena at a different time.  For example, we might try to create a model of an ice sheet that once covered Britain and vary the input parameters to see how it behaves.  The experiment here is to find the input parameters that best recreate what we think happened in the past.  Alternatively we may create a predictive model such as a general circulation model (GCM) of the Earth’s atmospheric systems and their interaction with land and sea in order to forecast the weather.  The predictions made by the model become the test of its accuracy.  At the other end of the continuum are more abstract models that are not grounded in a specific place and time but allow us to explore more theoretical relationships between the variables involved.
  • Agent based models. This type of model is a form of numerical model which empower individual elements with the power to make decisions.  Imaging a large crowded stadium and someone needlessly shouts ‘bomb’.  Each member of the crowd is capable of make its own decision; to you run left, right or duck.  Perhaps less dramatic is to think of a herd of wildebeest migrating on the Serengeti; in theory each animal can make a choice as to the route it will follow, although it may be highly influenced by other members of the herd.  We can simulate this numerically by giving each agent in the model an individual decision making capacity according to a set of pre-set rules and step back and observe.  There are lots of ecological and geographical systems that lend themselves to this type of modelling.


Modelling has played an important role in the debate about Gaia.

Lovelock and colleagues developed a conceptual model of a self-regulating world, known as Daisy world.  They were not modelling the Earth specifically simply illustrating how self-regulation might work.

diamodelFigure 2: Conceptual illustration of daisy world.  Think about the distribution of daises and why they occur where they do.


Daisy world is a very elegant model (Fig. 2).  To start with they imagine a world inhabited by just two types of daisy – black and white ones – warmed by a sun similar to our own that starts cold and gradually warms up.  Now at first the planet is cold and black daisies thrive since their black pigmentation allows them to absorb more radiation than their white counter parts which tends to reflect solar radiation (i.e. white daisies have a higher surface albedo or reflectance).  The planet is warmer than one might expect, but as the solar constant rises the black daisies begin to be scorched by the sun.  Progressively white daisies thrive, since they can reflect some of the excess heat and keep the planet cooler.  Planetary temperature is moderated in this way as the solar constant changes over time.  It is an elegant illustration of a thermal regulation without any teleological need (i.e. need for sentient thought).  The model can be made more complex by the introduction of grey daisies which thrive in intermediate conditions and by introducing grazing animals and then predators (Fig. 3).

reguFigure 3: Output from Daisy World model showing how temperature is regulated.

The model does not recreate reality or simulate a process that actually took place on Earth, but provides a conceptual illustration or demonstration of the principles of self-regulation and as such it is a supremely elegant piece of science communication.

Interestingly you can run a daisy world simulation for yourself using an agent based model (http://ccl.northwestern.edu/netlogo/models/Daisyworld).  While the original daisy world model was not an ABM the idea lends itself to individual based modelling and is a nice way of demonstrating the potential of such modelling approaches.

Composing computer programs to solve scientific problems is like writing poetry. You must choose every word with care and link it with the other words in perfect syntax. There is no place for verbosity or carelessness. To become fluent in a computer language demands almost the antithesis of modern loose thinking.

James Lovelock

Temperature regulation

So we know – or at least I hope you do – that daisies are not the answer just the illustration.  This still leaves the question of how the earth has moderated its temperature.  The simple answer is through plate tectonics.

One of the most important volcanic product is carbon dioxide; in terms of volume and impact it is far greater than anything else produced by an eruption.  The longest chains of volcanoes are those found at divergent plate boundaries, such as the mid-Atlantic ridge.  Large volumes of carbon dioxide are produced by sea floor spreading and at subduction zones.  So periods of geological time like the Mesozoic which are known to have been particularly warm are often associated with periods of active plate tectonics in this case the opening of the South and North Atlantic.

So if volcanism increases the carbon content and drives greenhouse conditions, what removes carbon dioxide?  Oceans absorb carbon dioxide but by far the most significant process is weathering.  Most rock forming minerals are silicate based and are easily attached by weak acid rain.  As rain fall it combines with carbon dioxide in the atmosphere and critically in the soil to form a weak carbonic acid (CO2 + H2O – H2CO3).  This weak acid attacks the silicates to give a carbonate which is removed in solution and is ultimately deposited in the oceans.  In the equation below X stands for any cation like sodium, potassium, or magnesium which are common rock forming elements.

equ

So weathering removes, or scrubs, carbon dioxide from the atmosphere.  The more weathering the more carbon dioxide is removed.  No weathering is favoured by warm and damp conditions and by surface area.  Think of a flat hill top, exposed rock is weathered and a weathered regolith is produced (add organic matter and you would have a soil).  As the regolith builds up it begins to slow the weathering rate since the fresh rock is increasingly at depth.  Now contrast this with a steep slope under similar conditions.  Here the regolith as it forms is removed by gravity and fresh bedrock remains at the surface to be weathered.  More weathering will result than on the fat surface.  So uplift and mountain building, both a consequence of plate tectonics, favour weathering.  So if we have lots of plate convergence creating fold mountains and uplift we tend to draw down atmospheric carbon dioxide.

thermFigure 4: The feedback between carbon dioxide, global temperature and weathering.

We are not sure what came before plate tectonics when the earth was very molten and very young, perhaps the first 0.5 billion years or so.  But with the advent of plate tectonics came movement and with it the creation of continental crust.  This was probably formed by the accretion of volcanoes along continental edges and their erosion to create sediments.  Slowly by the processes of subduction at convergent boundaries continental rocks were formed.  We call these ancient pieces of crust cratons or shield areas.  The effect was to create land surfaces for weathering drawing down carbon dioxide rapidly.  Not only was the process creating land for future life but also terra forming the atmosphere.

The faint sun in the early days of the Earth was countered by a thick greenhouse atmosphere, helping to retain heat.  As the crust and weathering kicked in the carbon dioxide levels began to fall rapidly.  Terra forming by bacteria and algae boosted oxygen levels at the expense of carbon dioxide.  As the solar constant increased the earth needed less greenhouse gases.  The complex interaction between volcanoes, plate tectonics, weathering and the evolution of life is responsible for maintaining global temperature in a equable state.  It is perhaps odd to think that life of earth was dependent on greenhouses gases.

Final word: to live or not?

Lovelock and his colleagues were brilliant agents of ‘spin’.  The choice of Gaia and the implication that the Earth was something to be revered as a living system was inspired.  Unfortunately it also caused many more staid scientists to shake their head and shrouded the scientific value of their core ideas in a lot of mystic metaphysical nonsense.  It all depends on how you define whether something is living.

They never set out to create a teleological model or to imply that Earth processes were driven by a higher ‘purpose’ simply to demonstrate how a complex system could self-organise.  Complex systems whether living or not can result in emergent behaviours in which the sum is greater than the component parts.

What distinguishes a Complex Adaptive System (CAS) from a pure multi-agent system (MAS) is the focus on system survival and characteristics such as self-similarity, complexity, emergence and self-organization. A MAS is defined as a system composed of multiple interacting agents but in a CAS, the agents as well as the system are adaptive. Complex Adaptive Systems are therefore characterised by a high degree of adaptive capacity, giving them resilience in the face of perturbation.  The Earth is an example of a CAS, resilient in the face of perturbation, a collection of self-similar agents adapting in ways that the system behaviour emerges beyond the behaviours of the individual agents.  The behaviour of the collective is not predicted by the behaviour of the components.

References

Charlson, R. J., Lovelock, J. E., Andreae, M. O. and Warren, S. G. (1987). “Oceanic phytoplankton, atmospheric sulphur, cloud albedo and climate”. Nature. 326 (6114): 655–661. Bibcode:1987Natur.326..655C. doi:10.1038/326655a0.

Lovelock, J.E. (2000) [1979]. Gaia: A New Look at Life on Earth (3rd ed.). Oxford University Press. ISBN 0-19-286218-9.

Lovelock, James (2007). The Revenge of Gaia. Penguin. ISBN 0-14-102597-2.

How to find instructions and tutorials on the web

If in doubt Google it! It is a good motto to have provided you have an internet connection.  Doesn’t have to be Google but the principle holds.   I am often faced with new tasks or worse i knew once but have forgotten.  I keep a notebook of web links and pasted information under a heading of ‘how to’, but I often need to seek further guidance.   Stretching your skill-set is a way of investing in yourself.  I do it all the time, so should you!

So let’s say you have do something in Adobe Photoshop which is unfamiliar or worse you did a few months ago and have forgotten!  It could be true of any software and many other skills.  Using a ‘how to . . .’ search in Google will surface most answers.  You simply need to select the best ones and compare a few posts.  The first answer you read is not always the best.  Here is some guidance on using Google, or any other search engine to its best.

Boolean Searches

Boolean searches allow you to combine words and phrases using the words AND, OR, NOT and NEAR (otherwise known as Boolean operators) to limit, widen, or define your search.  George Boole was an English mathematician in the 19th century who developed “Boolean Logic” in order to combine certain concepts and exclude certain concepts when searching databases. Most search engines use Boolean Logic.  Using Boolean Search terms you have two choices: you can use the standard Boolean operators (AND, OR, NOT, or NEAR), or you can use their mathematical equivalents.

  • The Boolean search operator AND is equal to the “+” symbol.
  • The Boolean search operator NOT is equal to the “-” symbol.
  • The Boolean search operator OR is the default setting of any search engine; meaning, all search engines will return all the words you type in, automatically.
  • The Boolean search operator NEAR is equal to putting a search query in quotes (i.e., “blood splatter analysis”). You’re essentially telling the search engine that you want all of these words, in this specific order or this specific phrase.

In summary, therefore, using AND narrows a search by combining terms; it will retrieve documents that use both the search terms you specify.  Using OR broadens a search to include results that contain either of the words you type in.  And finally using NOT will narrow a search by excluding certain search terms.

Example

So you what to create a plate of photographs to go in your coursework.  You have read the guidance and attended the lectures but you are still struggling?  Then ask Google.  If you don’t quite get what you are looking for the first time, re-phrase the question and also think laterally – ‘this is not quite right but I could use this technique and may be that one . . . to solve my problem’.

Once you have found something that is useful and quite informative it is a good idea to keep hold of it for future reference.  Now copying the URL to a notebook, especially an electronic one is a good idea.  Don’t just rely on bookmarks because they are browser and computer specific.  I also paraphrase some of the information to make my own crib-sheet especially if its something I am likely to use a lot.

 “There is so much information out there on the web!”

“Use it discerningly!”

“Also remember in software there is often more than one way of doing the same thing; one way is not necessarily any better than another so don’t stress.”

Making an argument

In a subject like geology or physical geography  there is no absolute answer, you can’t simply look up the solution in the back of the book.  You have to find and balance the evidence and make an argument from it.  Just as a barrister makes an argument in a court room geographers have to do the same.  They need to evaluate the evidence, marshal their ideas and present them coherently so that they win the day.  That is what a scientist does when writing an academic paper.  They  collect some data or conduct an experiment,  propose an explanation or hypothesis on the back of this and the marshal their own and others’ evidence (from the literature) to make the case.  Science can be quite gladiatorial with one scientist proposing an idea that another may oppose and attack.  This critical debate lies at the heart of our discipline and helps us winnow good ideas from bad.  In other areas debate is also essential.  For example if you are advising a decision-maker you need to articulate the evidence fairly and appropriately separating areas of fact from interpretation.  In doing so you need to make a balanced argument that is fair to all the evidence and stakeholders.  A geographer brings their unique spatial-analytical skills to bear in this way and makes an argument with words, diagrams and maps.  Whether expressed orally or in writing learning to make an argument is a critical skill and has to be learnt the hard way through practice. 

Words are how people think. When you misuse words, you diminish your ability to think clearly and truthfully.

When you use words loosely, without care and consideration, you erode trust in yourself and in what you’re saying. When you squander words, you diminish your power.

For good ideas and true innovation, you need human interaction, conflict, argument, debate.
Margaret Heffernan

Geographers make critical arguments using a range of different types of spatial data.  In the real-world this may be to influence a decision- or policy-maker, justify a position taken or a proposed course of action in the face of a problem.  Ensuring that your interpretation is valid and prevails is a vital skill for all geographers to learn.  It is important to note that there are often no absolute answers, no one perfect position or solution, simply a well-argued and convincing solution.

The Physical Geography Coursework 2018/19 is designed to make you think about geographical data and to then advance an argument using that data and concisely.

So what is an argument?

An argument is a clearly expressed, balanced, point of view supported by evidence.  Essentially it consists of a ‘claim’ that is evidenced with due consideration of possible ‘counter-claims’ or alternative interpretations and points of view.

Most geographical ideas are debated by someone, somewhere, at some time. Even when the material you read, hear or watch is presented as ‘fact’ it is in truth more likely to be one person’s interpretation of that information.  In the context of your course work it provides: (1) proof that you understand the material; and (2) demonstrates your ability to use or apply that material or understanding.  The latter point is important and can be done in several ways: you can critique the information, apply it to something else, or explain it well.  It helps however to have a particular point or position on the material; this constitutes a ‘claim’.

Clarity and structure is the key to success in writing.  The human form is supported by a skeleton (its structure), remove that skeleton and we are in the words of Spock ‘just bags of water’.  The structure you adopt depends on the aim of the piece, but the following are worth bearing in mind:

  • Your argument needs to be well-structured. You should start with a strong opening statement, an introduction if you like, in which the aim and ‘claim’ are clearly stated with some basic ‘signpost’ statements as to what is to follow.  This should be followed with the three/four key supporting reasons each with evidence or examples.  You should then introduce alternative or ‘counter-claims’ before returning in the conclusion to you ‘claim’.
  • You need to stay focused to the stated aim and to the structure. There is no scope to wander off and you should always keep the point.  No bonus points are given for digressions however erudite they may be.  If you stray you will weaken your argument and end up with a ramble or simply a dump of information.
  • In a coherent argument, all the parts relate to one another clearly flow one after the next in a logical order.
  • In terms of writing, development means stating a point of view (claim) and then supporting it with well-chosen reasons and evidence or examples. A good argument takes the reader by the hand along the path of the argument without allowing the reader to digress or get lost.

Different types of argument will require slightly different approaches or tacks.  It is often good to shake things up and to vary the approach.  However as a guide the following can be used for a 500-1000 word argument:

  • One or two sentences that state the problem, its importance and your perspective or point.
  • Before you start to write list the points in support of your claim.  Now rank them in order of importance.  Ask yourself how you can evidence each one; note this evidence under each one.  You are now ready to write.  Take the first three or four points.  Write about each providing the supporting evidence.
  • Counter-points. Be balanced are there alternative perspectives on the data?  List the counter-points and associated evidence and rank them in order of strength.  You are now ready to write.  Take the first two or three alternatives and present them fairly, then point out in a polite and moderate way how they fail to explain the evidence.
  • Return to you claim or central point restating briefly why it is the most valid perspective in your view.  Explore any implications that follow from your conclusion.

A good argument should contain references that are pertinent to the points being made and to evidence the contribution of other people’s work to your argument.  It should also be illustrated as appropriate.


Resources

Useful web-links include:

http://writingcenter.unc.edu/handouts/argument/

http://www.umuc.edu/writingcenter/onlineguide/tutorial/chapter8/ch8-08.html

http://www.sparknotes.com/testprep/books/newsat/powertactics/essay/chapter2section1.rhtml

http://www.englishbiz.co.uk/mainguides/argue.htm

Details on the BU referencing guide can be found at:

https://www1.bournemouth.ac.uk/discover/library/using-library/how-guides/how-cite-references